Plotting a Call Graph
Usage
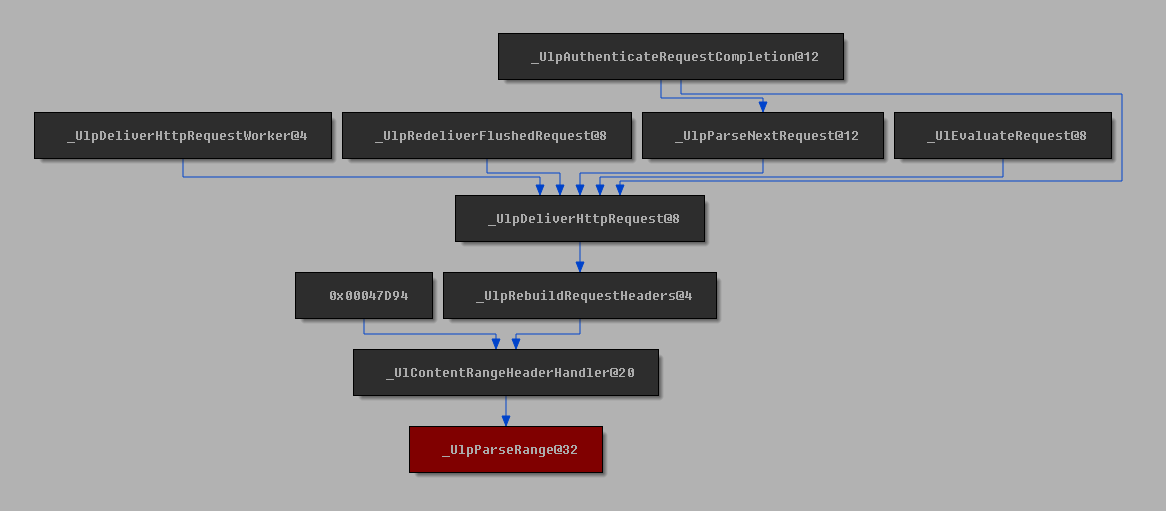
Using Windows 8.1 http.sys. Before MS15-034.
draw_call_graph(sark.Function(name="_UlpParseRange@32").ea, to=True, distance=4)
Code
import sark
import networkx as nx

def draw_call_graph(ea, distance=2, to=False):
    # First, get the IDB graph (caching it might be a good idea
    # as this operation can be time consuming on large IDBs)
    idb_graph = sark.graph.get_idb_graph()

    # Get the address of the function to use in the graph
    func_ea = sark.Function(ea).ea

    # Create the call graph
    if to:
        # If we want the calls to our function, we need to reverse
        # the graph
        idb_graph = idb_graph.reverse()

    # Use NetworkX to limit the IDB graph
    call_graph = nx.ego_graph(idb_graph, func_ea, distance)

    # Paint the root node red
    call_graph.node[func_ea][sark.ui.NXGraph.BG_COLOR] = 0x80

    if to:
        # If we reversed it before, we need to reverse it again
        # to make the links point the right way
        call_graph = call_graph.reverse()

    # Create an NXGraph viewer
    viewer = sark.ui.NXGraph(call_graph, handler=sark.ui.AddressNodeHandler())

    # Show the graph
    viewer.Show()